Timeseries

VIRUS-MVP vizualization is designed to be data-agnostic, allowing visualisation of viral sequences that can be grouped by any specified variable.

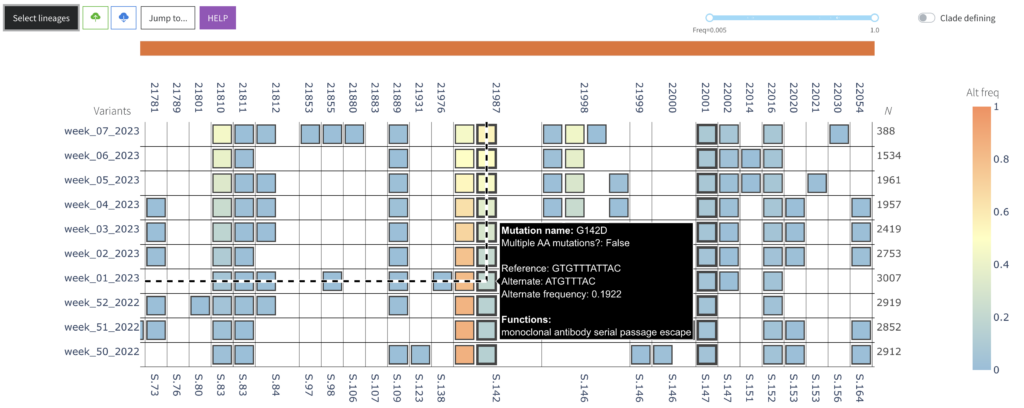
For example, sequences can be sorted by a period of time (default: 7 days) in order to identify the relative increase or decrease in mutation prevalence.

Below is a link to an interactive demo of the SARS-CoV-2 time series data.

Annotated SLURM Script to generate time series data

#!/bin/bash
#SBATCH --time=2:00:00
#SBATCH --job-name=nf-ncov-voc-timeseries
#SBATCH --cpus-per-task=4
#SBATCH --nodes=2
#SBATCH --mem-per-cpu=12G
#SBATCH --error=%x-%j.error
#SBATCH --output=%x-%j.out
module load nextflow
module load apptainer
nextflow run main.nf \
  -profile singularity \
  --prefix <prefix> \
  --grouping_criteria time \
  --mode reference \
  --skip_pangolin \
  --skip_nextclade \
  --startdate <yyyy-mm-dd> \
  --enddate <yyyy-mm-dd> \
  --outdir <results_dir>